.png)

Text based conditional formatting in Power BI
- Mara Pereira

- Nov 8, 2022
- 3 min read
Updated: Dec 1, 2022
Have you ever wondered if you can apply conditional formatting based on a text field/measure instead of a numeric field/measure?
If your answer is yes, then this trick is for you!
The other day I was working with a customer who asked something that I had no idea how to build.
They wanted to apply conditional formatting over some of their visuals, but they wanted the conditional formatting applied over a text field and not over a numeric field or a measure.
Let me give you a practical example. Imagine I have a table with sales data. In my table I have sales by country, product, shipping status etc.
Now, imagine that you wanted to apply conditional formatting over the status field which contains the following categories:
> Pending
> Shipped
> Cancelled
But... You don't have an "ID" column for the status, something like:

So you don't have that "Status ID" column, only the status text. I know, you could easily create the status ID column either in the Query Editor or as a calculated DAX column, but for the purpose of this post, let's imagine you can't or don't want to do that.
If you try to apply conditional formatting, you have 3 options.
You can use Rules as your formatting style, but for this you need a numeric value:
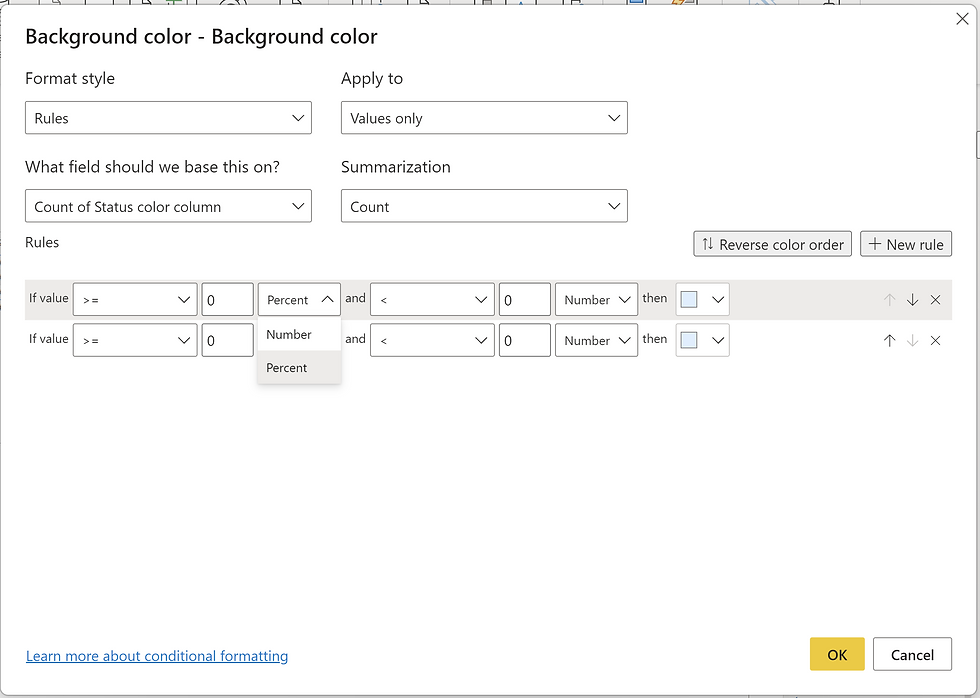
So, this option doesn't really work if your field is a text field or if your measure retrieves a text value.
The second option is using Gradient as your formatting style:

Which will allow you to use a text column, but not a measure that returns a text value.
Also, you can only have 3 options for your colors (Minimum value color, Center and Maximum) and it doesn't allow you to define the color based on the text, as the only summarisations possible for a text field are "Count" or "Distinct Count". This means that the color formatting will be based on the count of your text field, not the text itself.
This leaves us with a final third option... The Field Value formatting style:
In this case, you can use both a text column and a measure that retrieves a text value.
This is the secret option to apply conditional formatting over a text field!
But... how do you actually do this?
To make this work, you need to have a mapping of the HEX color codes and the text field you want to use for your conditional formatting, something like this:

In this example, I want to see a different color based on if the Sales Order is Cancelled (grey), Pending (yellow) or Shipped (green).
You don't need to have this mapping in a table/column though, but this trick would still work if you had it as a separate dim table or a column.
The first thing I'm going to do, is to create a measure that will do this "mapping" for me:
Status color =
var selected_status = SELECTEDVALUE(Amazon[Status L1])
return
if(selected_status= "Cancelled", "#D5D8DC",
    if(selected_status="Pending", "#F4D03F",
        if(selected_status="Shipped", "#27AE60", "#FDFEFE")))
Let's analyse this measure in parts:
Status color =
var selected_status = SELECTEDVALUE(Amazon[Status L1])
return
if(selected_status= "Cancelled", "#D5D8DC",
    if(selected_status="Pending", "#F4D03F",
        if(selected_status="Shipped", "#27AE60", "#FDFEFE")))
This variable will check what is the order status that is selected and will retrieve that text value.
Status color =
var selected_status = SELECTEDVALUE(Amazon[Status L1])
return
if(selected_status= "Cancelled", "#D5D8DC",
    if(selected_status="Pending", "#F4D03F",
        if(selected_status="Shipped", "#27AE60", "#FDFEFE")))
The if statement is then going to apply the "color mapping" we defined earlier.
If the status is Cancelled then it will retrieve the gray hex code (#D5D8DC) if it's Pending it will retrieve the yellow hex code (#F4D03F) and so on.
I don't recommend you to do this if you have 20 different text categories you want to apply your conditional formatting on for obvious reasons... You will end up with an infinite if statement...
As you already have your "mapping" measure, now it's time to apply the conditional formatting. In your conditional formatting options, select the type of formatting you want, Background color or Font Color (this won't work for Icons or Web URL options):

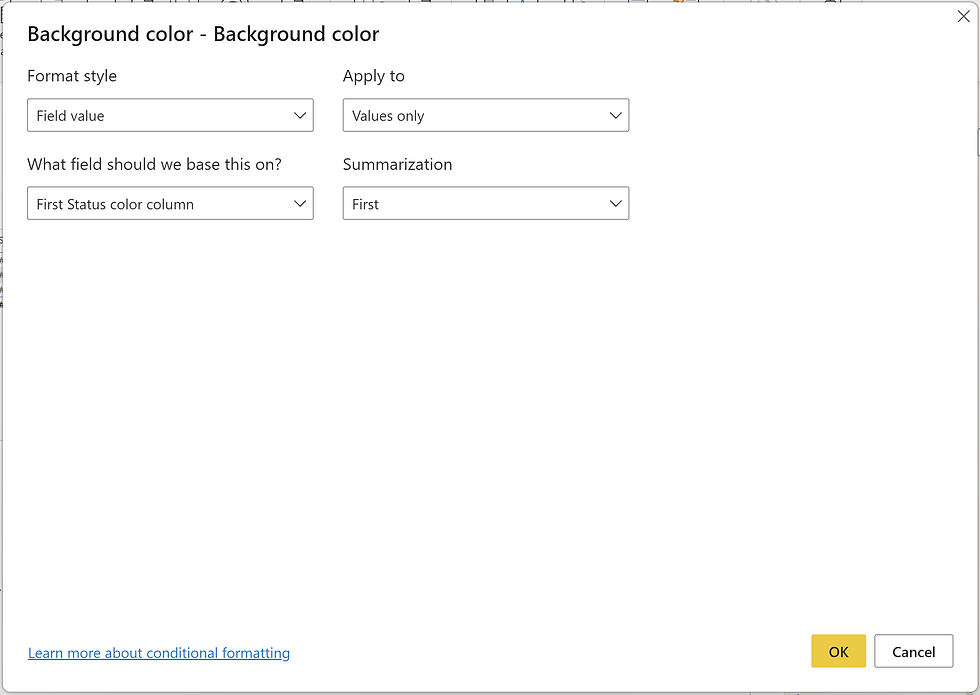
In the Conditional Formatting window select the Format Style "Field value" and then select your newly created measure:

The rest of the fields can remain with their default options (Summarization - First & Apply to - Values only).
Believe it or not, this is all you have to do!
This will work for the matrix and table visuals, but also for bar charts and other visuals that allow you to apply conditional formatting.
Now let's see this trick in action with an example.
Imagine you have the following table, which has the orders with a few details for each order and you want the text that contains the Order ID to be colored based on the order status field, which is a text (but we already created the mapping measure so no issues here!):

Like I mentioned before, you can do this not only for a matrix/table visual, but also for other visuals like bar charts:

Happy conditional formatting days!
Interested in learning more about Power BI Report Design? Then the Power BI Report Design Bootcamp is for you!


The guide on citric acid frogs Hawaii is informative and easy to follow, making it a great resource for local residents dealing with frog issues.
The guide on home demolition services is very helpful. It explains how residential projects can be completed safely and efficiently.
Modern vehicles are equipped with complex Advanced Driver Assistance Systems (ADAS) embedded directly behind the front fascias. Bringing a damaged vehicle to an auto body shop near me requires confirming they have the diagnostic capabilities to recalibrate these sensors. Do the mechanics conduct a comprehensive post-repair scan to ensure the radar and lane-departure cameras are communicating seamlessly with the central computer? Neglecting this electronic recalibration leaves drivers highly vulnerable.
Trenching a property for a new foundation requires exact depth calculations to ensure the footings sit below the regional frost line. Reaching out to professional excavation companies near me guarantees the earthwork meets strict municipal building codes. Do the heavy equipment operators utilize GPS-guided grading systems on their excavators to maintain a precise, level elevation across the entire footprint? Precision grading prevents the concrete crews from having to over-pour the foundation walls.
Protecting a home's siding from severe weather cycles involves meticulous scraping and replacing rotted trim boards before a single drop of paint is applied. Bringing in experienced crews for exterior house painting ensures the architectural envelope is thoroughly sealed. Do the painters utilize elastomeric caulking around the window casings to bridge wide gaps and accommodate the natural expansion and contraction of the wood? Using flexible sealants prevents moisture from infiltrating the wall cavity during heavy rainstorms.